Monitor your PDPs
Use the Monitoring page in the Permit.io dashboard to see which policy decision points (PDPs) are connected to Permit, and which PDP and Open Policy Agent (OPA) versions they run. This page is for operators who run self-hosted PDPs and roll out PDP upgrades.
The Monitoring page is an Early Access Program (EAP) feature. Its behavior, status meanings, data retention, and displayed fields can change between releases.
The Monitoring page shows the state of PDP instances at the moment you open it. It is not an audit history or an incident timeline. For decision history, use the audit logs.
Open the Monitoring page
- Sign in to the Permit dashboard.
- In the organization section of the left sidebar, click Monitoring.
- On the Pdps tab, filter the list with the Projects, Environments, Pdp (PDP version), and Opa (OPA version) filters, and the date range picker.
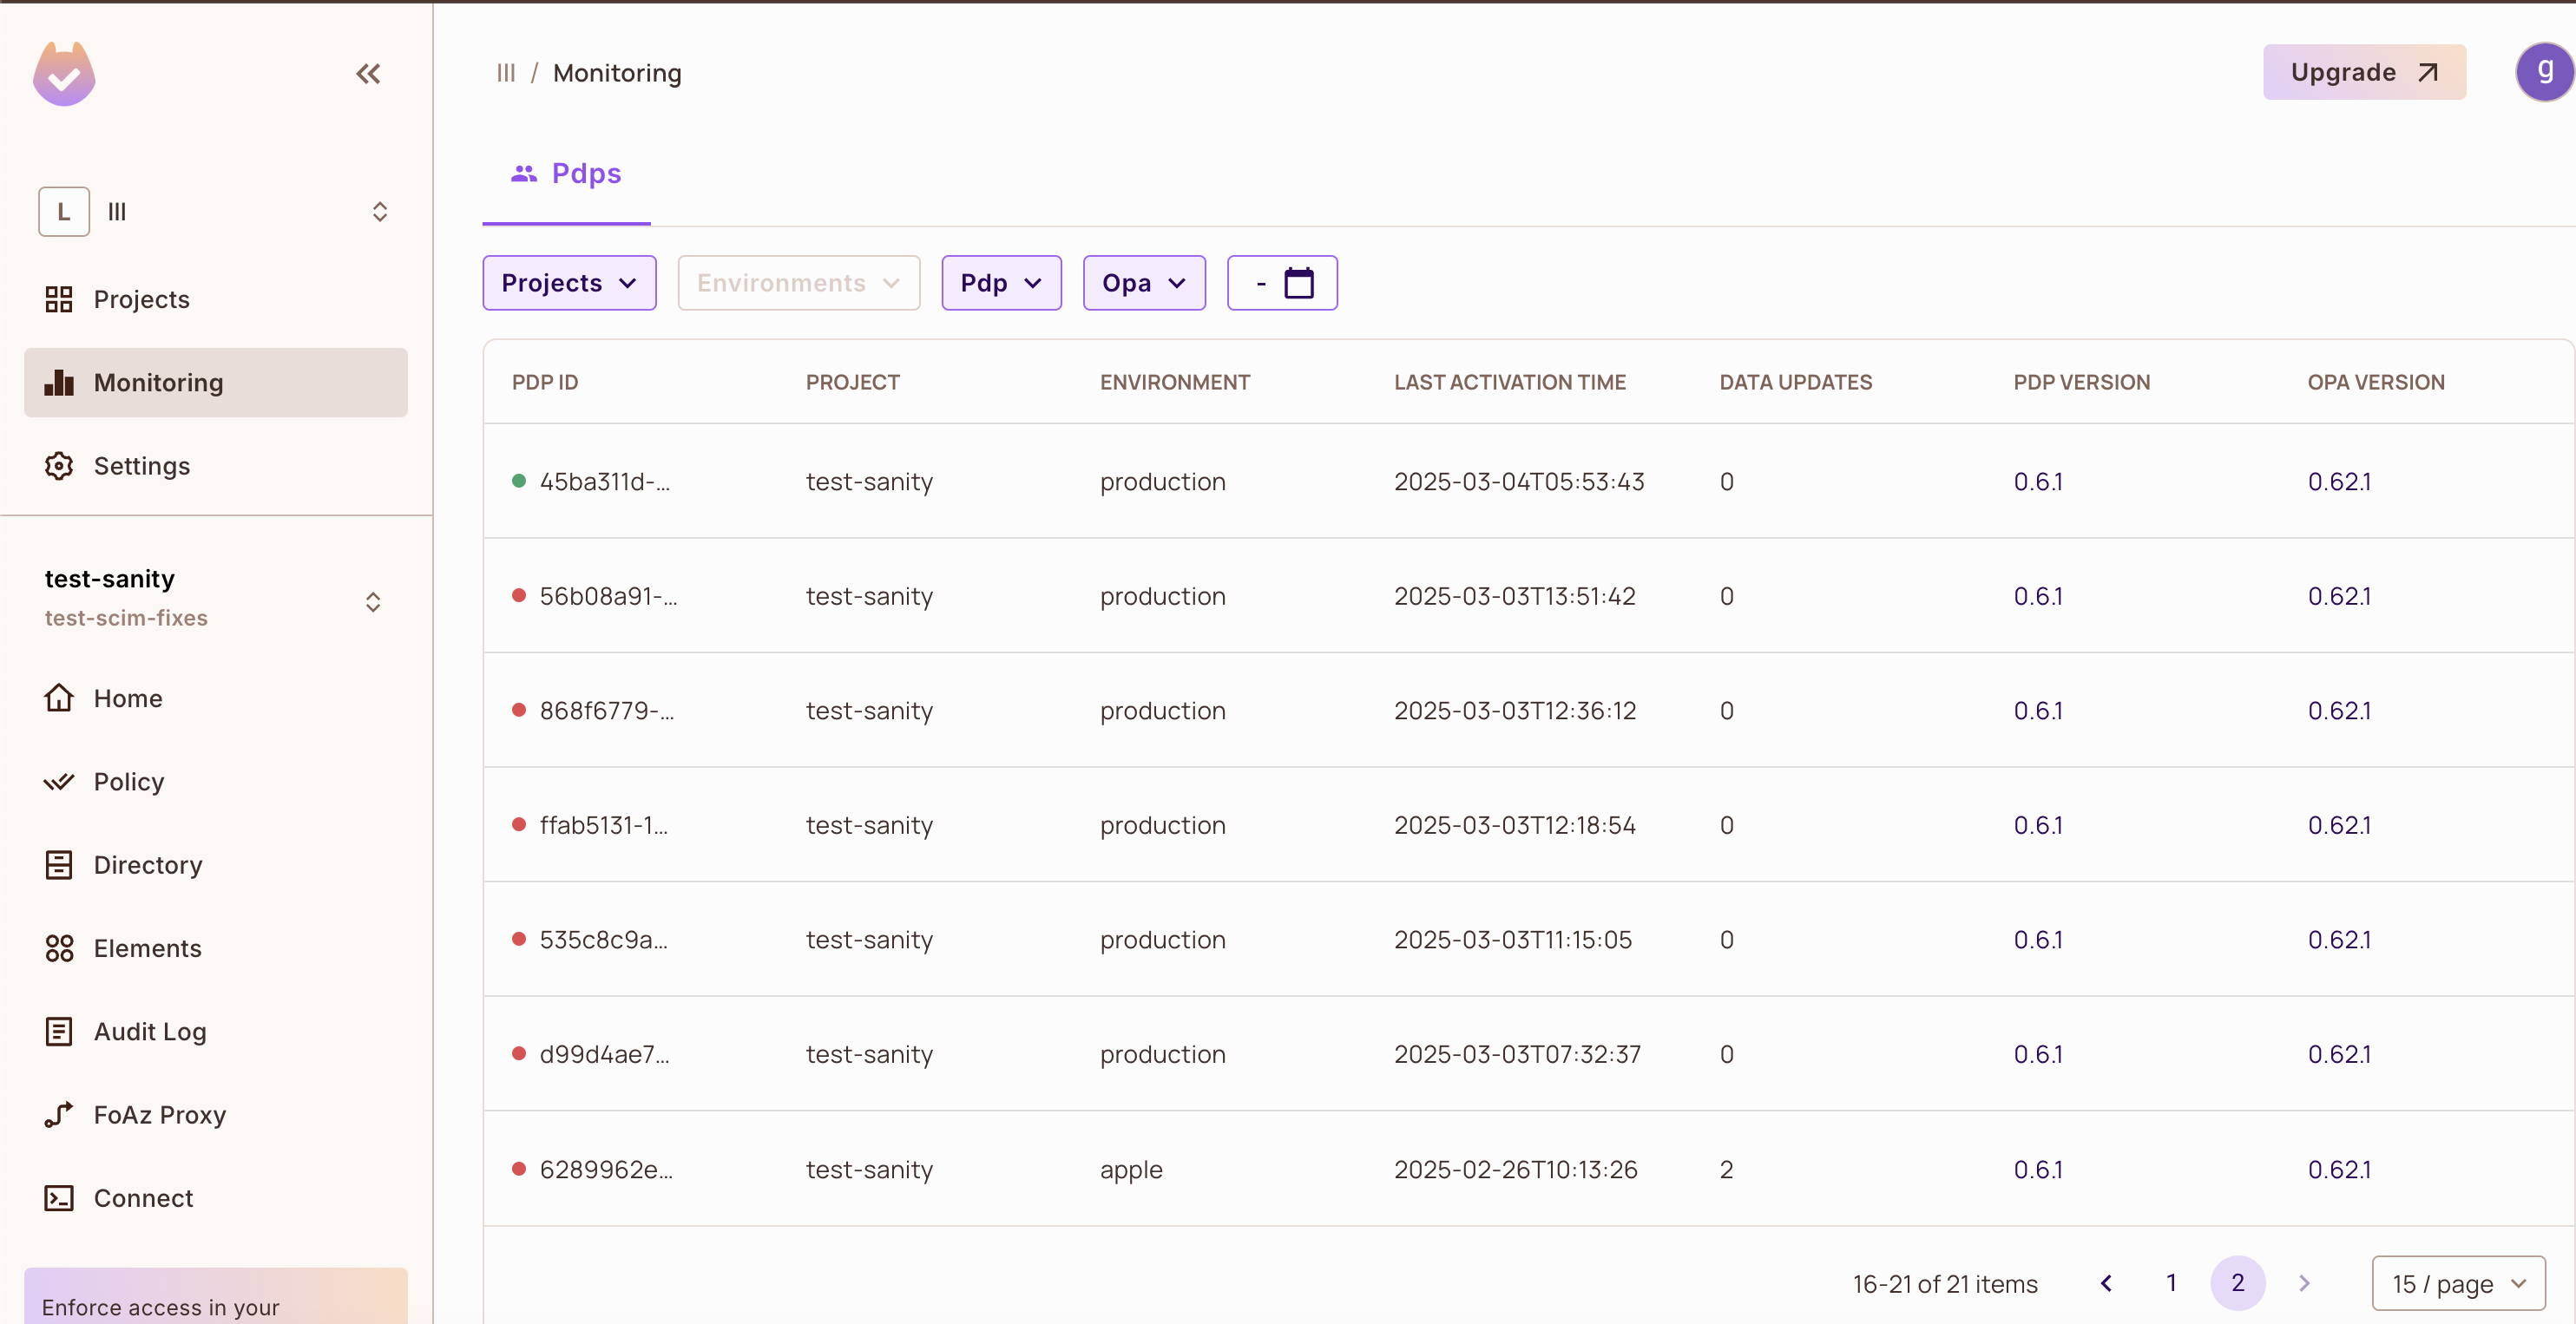
Columns on the Monitoring page
| Column | Description |
|---|---|
| Status dot (before PDP ID) | Green when the PDP is connected to the Permit control plane. Red when it isn't. |
| PDP ID | The identifier of the PDP instance. |
| Project | The project the PDP serves. |
| Environment | The environment the PDP serves. |
| Last activation time | The most recent activity time reported for the PDP. |
| Data updates | The number of data updates shown for the PDP. |
| PDP version | The version of the Permit PDP the instance runs. |
| OPA version | The version of OPA bundled in that PDP. |
What the connection status means
Green status: connected
A green PDP is connected to the Permit control plane at the time you view the page.
Red status: not connected
A red PDP is not connected to the control plane. A red PDP doesn't always mean a failure. A PDP turns red when:
- The PDP process was stopped.
- A container or pod restarted during a deployment. The previous instance stays on the list as red.
- The PDP instance was decommissioned.
- The PDP stopped checking in with the control plane.
Stopped PDPs stay visible on the Monitoring page, so red PDPs accumulate over time. In most production environments, red PDPs are earlier instances that were stopped, not running PDPs that lost their connection.
Why a list shows many red PDPs
| Cause | Why it adds red PDPs |
|---|---|
| Frequent deployments | Each release starts new PDP instances. The old instances stay on the list. |
| Kubernetes rolling updates and pod restarts | Each restart creates a new instance and leaves the previous one on the list. |
| Autoscaling | Scale-up creates instances. After scale-down, the removed instances show as red. |
When a PDP you expect to be running shows as red, check that PDP's container logs and its health endpoint. See Verify the PDP is healthy.
Connection status and PDP log errors
Connection status on the Monitoring page
The status dot shows whether the PDP is connected to the control plane at the time you view the page. It doesn't show past health check results.
Timeouts and errors in PDP logs
PDP logs can show read timeouts during consistent update requests, and HTTP 500 errors during sync operations. These log entries don't mean the PDP disconnected or failed a health check, and they don't change the status dot. They usually come from a client-side timeout that is too short.
Set the control plane timeout
PDP_CONTROL_PLANE_TIMEOUT sets how long, in seconds, the PDP waits for a request to the Permit control plane. The default is 75.
A short timeout, for example 5 seconds, makes long control plane requests fail with read timeout errors in the PDP logs. Keep the default of 75 seconds unless you have a reason to change it.
For other PDP settings, see PDP configuration.
Check PDP and OPA versions across a rollout
Use the Pdp and Opa filters, or the version columns, to:
- Find PDP instances that still run an older PDP or OPA version after a rollout.
- Confirm every connected PDP in each environment runs the version you deployed before you finish the rollout.
- Match an issue to a specific PDP and OPA version combination when you troubleshoot.
Upgrade PDPs that run an old version to a supported release. To change the PDP version, update the image tag in your deployment, for example pdp.image.tag in the Helm chart.
Related pages
- PDP statistics API: read PDP uptime and policy update statistics programmatically.
- PDP webhooks: get notified about PDP events.
- PDP overview: how the PDP works.
- PDP configuration: PDP settings and timeouts.